With Data Centers, What Can Happen Will Happen (Eventually).

Because data centers and telecom switching centers are designed to withstand failures without interrupting business operations, a 3 a.m. emergency due to a malfunctioning air conditioner should never occur – in theory. But Murphy’s Law says that if a single failure can create an emergency, it will. So, to date, operators have had to react to single-component failures as if they are business-critical. Because they might be.

In my previous blog, I pointed out the two components of risk: the probability of and the consequence of failure. While both of these components are important in failure analysis, it is the consequence of failure that’s most effective at helping decision-makers manage the cost of failure.

If you know there is a high probability of impending failure, but you don’t know the potential consequence, you have to act as though every threat has the potential for an expensive business interruption. Taking such actions is typically expensive. But if you know the consequence, even without knowing the probability of failure, you can react to inconsequential failures at your leisure and plan so that consequential failures are less likely.

In the past, the consequences of a failure weren’t knowable or predictable. The combination of Internet of Things (IoT) data and machine learning has changed all that. It’s now possible to predict the consequence of failure by analyzing large quantities of historical sensor data. These predictions can be performed on demand and without the need for geometrical data hall descriptions.

The advantage of machine learning-based systems is that predictive models are continually tuned to actual operating conditions. Even as things change and scale over time, the model remains accurate without manual intervention. The consequences of actions, in addition to equipment failures, become knowable and predictable.

This type of consequence analysis is particularly important for organizations that have a run-to-failure policy for mechanical equipment. Run-to-failure is common in organizations with severe capital constraints, but it only works, and avoids business interruptions, if the consequence of the next failure is predictable.

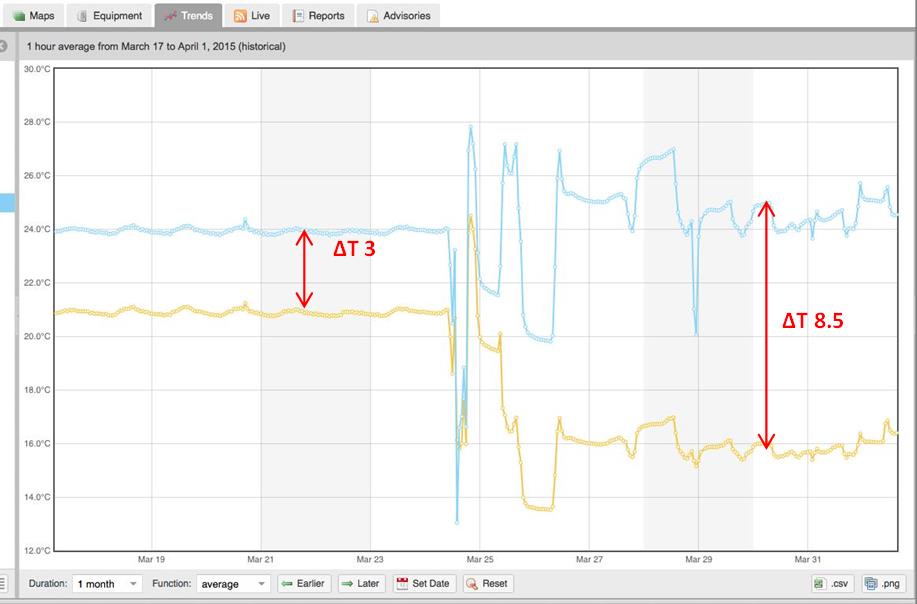
Predicting the consequence of failure allows an operations team to avoid over-reacting to failures that do not affect business continuity. Rather than dispatching a technician in the middle of the night, an operations team can address a predicted failure with minimal or no consequence during its next scheduled maintenance. If consequence analysis indicates that a cooling unit failure may put more significant assets at risk, the ability to predict how much time is available before a critical temperature is reached provides time for graceful shutdown – and mitigation.

Preventative maintenance carries risk, but equipment still needs to be shut off at times for maintenance. Will it cause a problem? Predictive consequence analysis can provide the answer. If there’s an issue with shutting off a particular unit, you can know in advance and provide spot cooling to mitigate the risks.

 The ability to predict the consequences of failure, or intentional action such as preventative maintenance, gives facility managers greater control over the reliability of their facilities, and the peace of mind that their operations are as safe as possible.

Consequence Planning Avoids Getting Trapped Between a Rack and a Hot Place

A decade of deploying machine learning in data centers and telecom switching centers throughout the world has taught us a thing or two about risk and reliability management.

In the context of reliability engineering, risk is often defined as the probability of failure times the consequence of the failure. The failure itself, therefore, is only half of the risk consideration. The resulting consequences are equally, and sometimes more, relevant. Data centers typically manage risk with redundancy to reduce the chances of failures that may cause a business interruption. This method reduces the consequence of single component failure. If failure occurs, a redundant component ensures continuity.

When people talk about the role of machine learning in risk and reliability management, most view machine learning from a similar perspective – as a tool for predicting the failure of single components.

But this focus falls short of the true capabilities of machine learning. Don’t get me wrong, predicting the probability of failure is useful – and difficult – to do. But it only has value when the consequence of the predicted failure is significant.

When data centers and telecom switching centers perform and operate as designed, the consequences of most failures are typically small. But most data centers don’t operate as designed, especially the longer they run.

Vigilent uses machine learning to predict the consequences of control actions. We use machine learning to train our Influence Map™ to make accurate predictions of cooling control actions, including what will happen when a cooling unit is turned on or off. If the Influence Map predicts that turning a particular unit off would cause a rack to become too hot, the system won’t turn that cooling unit off.

The same process can be used to predict the consequence of a cooling unit failure. In other words, the Influence Map can predict the potential business impact of a particular cooling unit failure, such as whether a rack will get hot enough to impact business continuity. This kind of failure analysis simultaneously estimates the redundancy of the cooling system.

This redundancy calculation doesn’t merely compare the total cooling capacity with the total heat load of the equipment. Fully understanding the consequence of a failure requires both predictive modeling and machine learning. Together, these technologies accurately model actual, real time system behavior in order to predict and manage the cost of that failure.

This is why the distinction between failures and consequences matter. Knowing the consequences of failure enables you to predict the cost of failure.

Some predicted failures might not require a 3 a.m. dispatch. In my next blog, I’ll outline the material advantages of understanding consequences and the resulting effect on redundancy planning and maintenance operations.

Analytics in Action for Data Center Cooling

When a data center is first designed, everything is tightly controlled. Rack densities are all the same. The layout is precisely planned and very consistent. Power and space constraints are well-understood. The cooling system is modeled – sometimes even with CFD – and all of the cooling units operate at the same level.

But the original design is often a short-lived utopia. The realty of most data centers becomes much more complex as business needs and IT requirements change and equipment moves in and out.

As soon as physical infrastructure changes, cooling capacity and redundancy are affected.  Given the complexity of design versus operational reality, many organizations have not had the tools to understand what has changed or degraded, so cannot make informed decisions about their cooling infrastructure. Traditional DCIM products often focus on space, network and power.  They don’t provide detailed, measured data on the cooling system.  So, decisions about cooling are made without visibility into actual conditions.

Analytics can help. Contrary to prevailing views, analytics don’t necessarily take a lot of know-how or data analysis skills to be extremely helpful in day-to-day operations management. Analytics can be simple and actionable. Consider the following examples of how a daily morning glance at thermal analytics helped these data center managers quickly identify and resolve some otherwise tricky thermal issues.

In our first example, the manager of a legacy, urban colo data center with DX CRAC units was asked to determine the right place for some new IT equipment. There were several areas with space and power available, but determining which of these areas had sufficient cooling was more challenging. The manager used a cooling influence map to identify racks cooled by multiple CRACs. He then referenced a cooling capacity report to confirm that more than one of these CRACs had capacity to spare. By using these visual analytics, the manager was able to place the IT equipment in an area with sufficient, and redundant, cooling.

In a second facility, a mobile switching center for a major telco, the manager noticed a hot spot on the thermal map and sent a technician to investigate the location. The technician saw that some of the cooling coils had low delta T even though the valves were open, which implied a problem with the hydronics. Upon physical investigation of the area, he discovered that this was caused by trapped air in the coil, so he bled it off. The delta T quickly went from 3 to 8.5 – a capacity increase of more than 65 percent – as displayed on the following graph:


DeltaT

These examples are deceptively simple. But without analytics, the managers would not have been able to as easily identify the exact location of the problem, the cooling units involved, and have enough information to direct trouble-shooting action within the short time needed to resolve problems in a mission critical facility.

Analytics typically use the information already available in a properly monitored data center. They complement the experienced intuition of data center personnel with at-a-glance data that helps identify potential issues more quickly and bypasses much of the tedious, blood pressure-raising and time-consuming diagnostic activities of hotspot resolution.

Analytics are not the future. Analytics have arrived. Data centers that aren’t taking advantage of them are riskier and more expensive to operate, and place themselves at competitive disadvantage

Data Center Capacity Planning – Why Keep Guessing?

Capacity management involves decisions about space, power, and cooling.

Space is the easiest. You can assess it by inspection.

Power is also fairly easy. The capacity of a circuit is knowable. It never changes. The load on a circuit is easy to measure.

Cooling is the hardest. The capacity of cooling equipment changes with time. Capacity depends on how the equipment is operated, and it degrades over time. Even harder is the fact that cooling is distributed. Heat and air follow the paths of least resistance and don’t always go where you would expect. For these reasons and more, mission-critical facilities are designed for and built with far more cooling capacity than they need. And yet many operators add even more cooling each time there is a move, add, or change to IT equipment, because that’s been a safer bet than guessing wrong.

Here is a situation we frequently observe:

Operations will receive frequent requests to add or change IT loads as a normal course of business.  In large or multi-site facilities, these requests may occur daily.  Let’s say that operations receives a request to add 50 kW to a particular room.  Operations will typically add 70 kW of new cooling.

This provisioning is calculated assuming a full load for each server, with the full load being determined from server nameplate data.  In reality, it’s highly unlikely that all cabinets in a room will be fully loaded, and it is equally unlikely that the server will ever require its nameplate power.  And remember, the room was originally designed with excess cooling capacity.  When you add even more cooling to these rooms, you have escalated over-provisioning.  Capital and energy are wasted.

We find that cooling utilization is typically 35 to 40%, which leaves plenty of excess capacity for IT equipment expansions.  We also find that in 5-10% of situations, equipment performance and capacity has degraded to the point where cooling redundancy is compromised.  In these cases, maintenance becomes difficult and there is a greater risk of IT failure due to a thermal event. So, it’s important to know how a room is running before adding cooling.  But it isn’t always easy to tell if cooling units are not performing as designed and specified.

How can operations managers make more cost effective – and safe – planning decisions?  Analytics.

Analytics using real-time data provides managers with the insight to determine whether or not cooling infrastructure can handle a change or expansion to IT equipment, and to manage these changes while minimizing risk.  Specifically, analytics can quantify actual cooling capacity, expose equipment degradation, and reveal where there is more or less cooling reserve in a room for optimal placement of physical and virtual IT assets.

Consider the following analytics-driven capacity report.  Continually updated by a sensor network, the report clearly displays exactly where capacity is available and where it is not.  With this data alone, you can determine where capacity exists and where you can safely and immediately add capacity with no CapEx investment.  And, in those situations where you do need to add additional cooling, it will predict with high confidence what you need. (click on the image for a full-size version)

Cooling Capacity

Yet you can go deeper still.  By pairing the capacity report with a cooling reserve map (below), you can determine where you can safely place additional load in the desired room.  You can also see where you should locate your most critical assets and, when you need that new air conditioner, and where you should place it.

(click on the image for a full size version)thermalcircle

Using these reports, operations can:

  • avoid the CapEx cost of more cooling every time IT equipment is added;
  • avoid the risk of cooling construction in production data rooms when it is often not needed;
  • avoid the delayed time to revenue from adding cooling to a facility that doesn’t need it.

In addition, analytics used in this way avoids unnecessary energy and maintenance OpEx costs.

Stop guessing and start practicing the art of avoidance with analytics.


Maintenance is Risky

No real surprise here. Mission critical facilities that pride themselves on and/or are contractually obligated to provide the “five 9’s” of reliability know that sooner or later they must turn critical cooling equipment off to perform maintenance. And they know that they face risk each time they do so.

This is true even for the newest facilities. The minute a facility is turned up, or IT load is added, things start to change. The minute a brand new cooling unit is deployed, it starts to degrade – however incrementally. And that degree of degradation is different from unit to unit, even when those units are nominally identical.

In a risk and financial performance panel presentation at a recent data center event sponsored by Digital Realty, ebay’s Vice President of Global Foundation Services Dean Nelson recently stated that “touching equipment for maintenance increases Probability of Failure (PoF).” Nelson actively manages and focuses on reducing ebay’s PoF metric throughout the facilities he manages.

Performing maintenance puts most facility managers between the proverbial rock and a hard place. If equipment isn’t maintained, by definition you have a “run to failure” maintenance policy. If you do maintain equipment, you incur risk each time you turn something off. The telecom industry calls this “hands in the network” which they manage as a significant risk factor.

What if maintenance risks could be mitigated? What if you could predict what would happen to the thermal conditions of a room and, even more specifically, what racks or servers could be affected if you took a particular HVAC unit offline?

This ability is available today. It doesn’t require computational fluid dynamics (CFD) or other complicated tools that rely on physical models. It can be accomplished through data and analytics. That is, analytics continually updated by real-time data from sensors instrumented throughout a data center floor. Gartner Research says that hindsight based on historical data, followed by insight based on current trends, drives foresight.

Using predictive analytics, facility managers can also determine exactly which units to maintain and when – in addition to understanding the potential thermal affect that each maintenance action will have on every location in the data center floor.

If this knowledge was easily available, what facility manager wouldn’t choose to take advantage of it before taking a maintenance action? My next blog post will provide a visual example of the analysis facility managers can perform to determine when and where to perform maintenance while simultaneously reducing risk to more critical assets and the floor as a whole.

Predictive Analytics & Data Centers: A Technology Whose Time Has Come

Back in 1993, ASHRAE organized a competition called the “Great Energy Predictor Shootout,” a competition designed to evaluate various analytical methods used to predict energy usage in buildings.  Five of the top six entries used artificial neural networks.  ASHRAE organized a second energy predictor shootout in 1994, and this time the winners included a balance of neural networks and non-linear regression approaches to prediction and machine learning.  And yet, as successful as the case studies were, there was little to no adoption of this compelling technology.

Fast forward to 2014 when Google announced its use of machine learning leveraging neural networks to “optimize data center operations and drive…energy use to new lows.”  Google uses neural networks to predict power usage effectiveness (PUE) as a function of exogenous variables such as outdoor temperature, and operating variables such as pump speed. Microsoft too has stepped up to endorse the significance of machine learning for more effective prediction analysis.  Joseph Sirosh, corporate vice president at Microsoft, says:  “traditional analysis lets you predict the future. Machine learning lets you change the future.”  And this recent article advocates the use of predictive analytics for the power industry.

The Vigilent system also embraces this thinking, and uses machine learning as an integral part of its control software.  Specifically, Vigilent uses continuous machine learning to ensure that predictions driving cooling control decisions remain accurate over time, even as conditions change (see my May 2013 blog for more details).  Vigilent predictive analysis continually informs the software of the likely result of any particular control decision, which in turn allows the software to extinguish hot spots – and most effectively optimize cooling operations with desired parameters to the extent that data center design, layout and physical configuration will allow.

This is where additional analysis tools, such as the Vigilent Influence Map™, become useful.  The Influence Map provides a current, real-time and highly visual display of which cooling units are cooling which parts of the data floor.

As an example, one of our customers saw that he had a hot spot in a particular area that hadn’t been automatically corrected by Vigilent.  He reviewed his Vigilent Influence Map and saw that the three cooling units closest to the hot spot had little or no influence on the hot spot.  The Influence Map showed that cooling units located much farther away were providing some cooling to the problem area.  Armed with this information, he investigated the cooling infrastructure near the hot spot and found that dampers in the supply ductwork from the three closest units were closed.  Opening them resolved the hot spot.  The influence map provided insight that helped an experienced data center professional more quickly identify and resolve his problem and ensure high reliability of the data center.

Operating a data center without predictive analytics is like driving a car facing backwards.  All you can see is where you’ve been and where you are right now.  Driving a car facing backwards is dangerous.   Why would anyone “drive” their data center in this way?

Predictive analytics are available, proven and endorsed by technology’s most respected organizations.  This is a technology whose time has not only come, but is critical to the reliability of increasingly complex data center operations.

IMG_7525_cliff250