When a data center is first designed, everything is tightly controlled. Rack densities are all the same. The layout is precisely planned and very consistent. Power and space constraints are well-understood. The cooling system is modeled – sometimes even with CFD – and all of the cooling units operate at the same level.
But the original design is often a short-lived utopia. The realty of most data centers becomes much more complex as business needs and IT requirements change and equipment moves in and out.
As soon as physical infrastructure changes, cooling capacity and redundancy are affected. Given the complexity of design versus operational reality, many organizations have not had the tools to understand what has changed or degraded, so cannot make informed decisions about their cooling infrastructure. Traditional DCIM products often focus on space, network and power. They don’t provide detailed, measured data on the cooling system. So, decisions about cooling are made without visibility into actual conditions.
Analytics can help. Contrary to prevailing views, analytics don’t necessarily take a lot of know-how or data analysis skills to be extremely helpful in day-to-day operations management. Analytics can be simple and actionable. Consider the following examples of how a daily morning glance at thermal analytics helped these data center managers quickly identify and resolve some otherwise tricky thermal issues.
In our first example, the manager of a legacy, urban colo data center with DX CRAC units was asked to determine the right place for some new IT equipment. There were several areas with space and power available, but determining which of these areas had sufficient cooling was more challenging. The manager used a cooling influence map to identify racks cooled by multiple CRACs. He then referenced a cooling capacity report to confirm that more than one of these CRACs had capacity to spare. By using these visual analytics, the manager was able to place the IT equipment in an area with sufficient, and redundant, cooling.
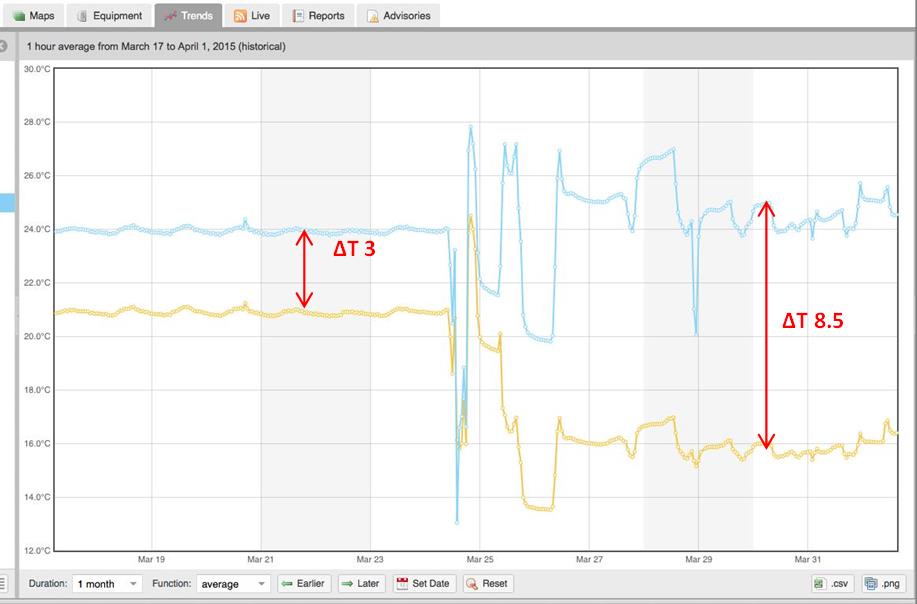
In a second facility, a mobile switching center for a major telco, the manager noticed a hot spot on the thermal map and sent a technician to investigate the location. The technician saw that some of the cooling coils had low delta T even though the valves were open, which implied a problem with the hydronics. Upon physical investigation of the area, he discovered that this was caused by trapped air in the coil, so he bled it off. The delta T quickly went from 3 to 8.5 – a capacity increase of more than 65 percent – as displayed on the following graph:
These examples are deceptively simple. But without analytics, the managers would not have been able to as easily identify the exact location of the problem, the cooling units involved, and have enough information to direct trouble-shooting action within the short time needed to resolve problems in a mission critical facility.
Analytics typically use the information already available in a properly monitored data center. They complement the experienced intuition of data center personnel with at-a-glance data that helps identify potential issues more quickly and bypasses much of the tedious, blood pressure-raising and time-consuming diagnostic activities of hotspot resolution.
Analytics are not the future. Analytics have arrived. Data centers that aren’t taking advantage of them are riskier and more expensive to operate, and place themselves at competitive disadvantage


Speak Your Mind