How Did I Live Without My AI-Driven Cooling?

Driving the other day, I decided to grab a quick bite to eat on the way home. I quickly launched my maps application, searched on the type of food I wanted, picked a local place, made sure they had decent reviews, checked their hours, and started the navigation guidance to tell me how to get there quickly.

When I did this, I was hungry. A few seconds later, I was on my way to solving that issue.

But I didn’t break it down that I was using a mobile-sized computer to triangulate my position on the globe from satellites. I didn’t then overlay a series of restaurants from a back-end database on top of that map, which was then integrated with a reviews database as well as location-specific information about that restaurant and its hours of operation. I didn’t follow that up by evaluating different routes from my current location to the restaurant, and deciding which one to take.

This was all on auto-pilot. I decided I wanted food, looked up restaurants, made sure the food was good, the place was open, and went. This took just seconds of my time.

We get so much information from simple swipes and glances that we forget what’s really guiding all of those interactions under the hood.

All the ways that we live, work, drive, interact…have all gone beyond the scope of what many of these technologies were originally designed to do.

And it only makes sense that this sort of distillation of technology to simplify our lives has also found its way into the data center, especially with the advancement of artificial intelligence for optimization and operation of cooling systems. Data Center Knowledge described recent advancements in an article on machine learning.

We’re not quite at the fully automated, human-to-computer interfaces seen in futuristic shows like Star Trek, but the day is rapidly approaching when you can “make it so.” Just like the technology above, you’ll wonder how you ever managed without AI-driven cooling(tm).

In an AI-driven data center, you can already:

  • Continually monitor conditions on your console or mobile device, from anywhere
  • Know which racks have redundant cooling so you can orchestrate variable workloads automatically
  • Identify the effects of “hands in the network” by viewing real-time or time-sequenced heat maps and data
  • See where the cooling is being delivered using Influence Maps™
  • See when floor panels haven’t been put back or blanked
  • Verify that work has been completed successfully using data and performance metrics (and hold vendors accountable)
  • Review anomalies that result from unexpected behavior even if they have already been mitigated by AI-driven cooling, and then review the data to see what and where you need to focus

This real-time information is immediately and continually visible from your dashboard. Walking the floor is only necessary for physical or configuration changes.

You can already see – and be able to prove – whether you really need that new CRAC, or if by shifting IT load or cooling you’ll net the same effect. You can see if your free cooling is operating as designed and have the data to troubleshoot it if not. AI-driven cooling automatically resolves issues and gives you the additional time – and critical data — to investigate further if need be.

AI-driven cooling enables autonomous, truly remote data centers to become even more cost effective as your best facility personnel can manage your most critical facilities – from miles or continents away.

Highly variable data centers which house very high-density high-heat-producing racks, in the proximity of others that don’t, will be easier to manage with less stress. Because AI-driven cooling understands the distinct cooling requirements of any situation it can automatically manage airflow within the same room for optimum efficiency.

When Fortune Magazine forecasted the “25 Ways AI is Changing Business,” they said that “the reality is that no one knows or can know what’s ahead, not even approximately. The reason is that we can never foresee human ingenuity, all the ways in which millions of motivated entrepreneurs and managers worldwide will apply rapidly improving technology.” But just as you and I have already seen what AI and mobile phone technology has done for our lives, so will it be for data center infrastructure.

And, like the power available through our mobile phones, someday soon we’ll wonder how we ever managed without AI-driven data centers.
With Data Centers, What Can Happen Will Happen (Eventually).

Because data centers and telecom switching centers are designed to withstand failures without interrupting business operations, a 3 a.m. emergency due to a malfunctioning air conditioner should never occur – in theory. But Murphy’s Law says that if a single failure can create an emergency, it will. So, to date, operators have had to react to single-component failures as if they are business-critical. Because they might be.

In my previous blog, I pointed out the two components of risk: the probability of and the consequence of failure. While both of these components are important in failure analysis, it is the consequence of failure that’s most effective at helping decision-makers manage the cost of failure.

If you know there is a high probability of impending failure, but you don’t know the potential consequence, you have to act as though every threat has the potential for an expensive business interruption. Taking such actions is typically expensive. But if you know the consequence, even without knowing the probability of failure, you can react to inconsequential failures at your leisure and plan so that consequential failures are less likely.

In the past, the consequences of a failure weren’t knowable or predictable. The combination of Internet of Things (IoT) data and machine learning has changed all that. It’s now possible to predict the consequence of failure by analyzing large quantities of historical sensor data. These predictions can be performed on demand and without the need for geometrical data hall descriptions.

The advantage of machine learning-based systems is that predictive models are continually tuned to actual operating conditions. Even as things change and scale over time, the model remains accurate without manual intervention. The consequences of actions, in addition to equipment failures, become knowable and predictable.

This type of consequence analysis is particularly important for organizations that have a run-to-failure policy for mechanical equipment. Run-to-failure is common in organizations with severe capital constraints, but it only works, and avoids business interruptions, if the consequence of the next failure is predictable.

Predicting the consequence of failure allows an operations team to avoid over-reacting to failures that do not affect business continuity. Rather than dispatching a technician in the middle of the night, an operations team can address a predicted failure with minimal or no consequence during its next scheduled maintenance. If consequence analysis indicates that a cooling unit failure may put more significant assets at risk, the ability to predict how much time is available before a critical temperature is reached provides time for graceful shutdown – and mitigation.

Preventative maintenance carries risk, but equipment still needs to be shut off at times for maintenance. Will it cause a problem? Predictive consequence analysis can provide the answer. If there’s an issue with shutting off a particular unit, you can know in advance and provide spot cooling to mitigate the risks.

 The ability to predict the consequences of failure, or intentional action such as preventative maintenance, gives facility managers greater control over the reliability of their facilities, and the peace of mind that their operations are as safe as possible.

The Real Cost of Cooling Configuration Errors

Hands in the network cause problems. A setting adjusted once, based on someone’s instinct of what needed to be changed at one moment in time, is often unmodified years later.

This is configuration rot. If your data center has been running for a while, the chances are pretty high that your cooling configurations, to name one example, are wildly out of sync. It’s even more likely you don’t know about it.

Every air conditioner is controlled by an embedded computer. Each computer supports multiple configuration parameters. Each of these different configurations can be perfectly acceptable. But a roomful of air conditioners with individually sensible configurations can produce bad outcomes when their collective impact is considered.

I recently toured a new data center in which each air conditioner supported 17 configuration parameters affecting temperature and humidity. There was a lot of unexplainable variation in the configurations. Six of the 17 configuration settings varied by more than 30%, unit to unit. Only five configurations were the same. Configuration variation initially and entropy over time wastes energy and prevents the overall air conditioning system from producing an acceptable temperature and humidity distribution.

Configuration errors contribute to accidental de-rating and loss of capacity. This wastes energy, and it’s costly from a capex perceptive. Perhaps you don’t need a new air conditioner. Instead, perhaps you can optimize or synchronize the configurations for the air conditioners you already have and unlock the capacity you need. Another common misconfiguration error is incompatible set points. If one air conditioner is trying to make a room cold and another is trying to make it warmer, the units will fight.

Configuration errors also contribute to poor free cooling performance. Misconfiguration can lock out free cooling in many ways.

The problem is significant. Large organizations use thousands of air conditioners. Manual management of individual configurations is impossible. Do the math. If you have 2000 air conditioners, each of which has up to 17 configuration parameters, you have 34,000 configuration possibilities, not to mention the additional external variables. How can you manage, much less optimize configurations over time?

Ideally, you need intelligent software that manages these configurations automatically. You need templates that prescribe optimized configuration. You need visibility to determine, on a regular basis, which configurations are necessary as conditions change. You need exception handling, so you can temporarily change configurations when you perform tasks such as maintenance, equipment swaps, and new customer additions, and then make sure the configurations return to their optimized state afterward. And, you need a system that will alert you when someone tries to change a configuration, and/or enforce optimized configurations automatically.

This concept isn’t new. It’s just rarely done. But if you aren’t aggressively managing configurations, you are losing money.

Analytics in Action for Data Center Cooling

When a data center is first designed, everything is tightly controlled. Rack densities are all the same. The layout is precisely planned and very consistent. Power and space constraints are well-understood. The cooling system is modeled – sometimes even with CFD – and all of the cooling units operate at the same level.

But the original design is often a short-lived utopia. The realty of most data centers becomes much more complex as business needs and IT requirements change and equipment moves in and out.

As soon as physical infrastructure changes, cooling capacity and redundancy are affected.  Given the complexity of design versus operational reality, many organizations have not had the tools to understand what has changed or degraded, so cannot make informed decisions about their cooling infrastructure. Traditional DCIM products often focus on space, network and power.  They don’t provide detailed, measured data on the cooling system.  So, decisions about cooling are made without visibility into actual conditions.

Analytics can help. Contrary to prevailing views, analytics don’t necessarily take a lot of know-how or data analysis skills to be extremely helpful in day-to-day operations management. Analytics can be simple and actionable. Consider the following examples of how a daily morning glance at thermal analytics helped these data center managers quickly identify and resolve some otherwise tricky thermal issues.

In our first example, the manager of a legacy, urban colo data center with DX CRAC units was asked to determine the right place for some new IT equipment. There were several areas with space and power available, but determining which of these areas had sufficient cooling was more challenging. The manager used a cooling influence map to identify racks cooled by multiple CRACs. He then referenced a cooling capacity report to confirm that more than one of these CRACs had capacity to spare. By using these visual analytics, the manager was able to place the IT equipment in an area with sufficient, and redundant, cooling.

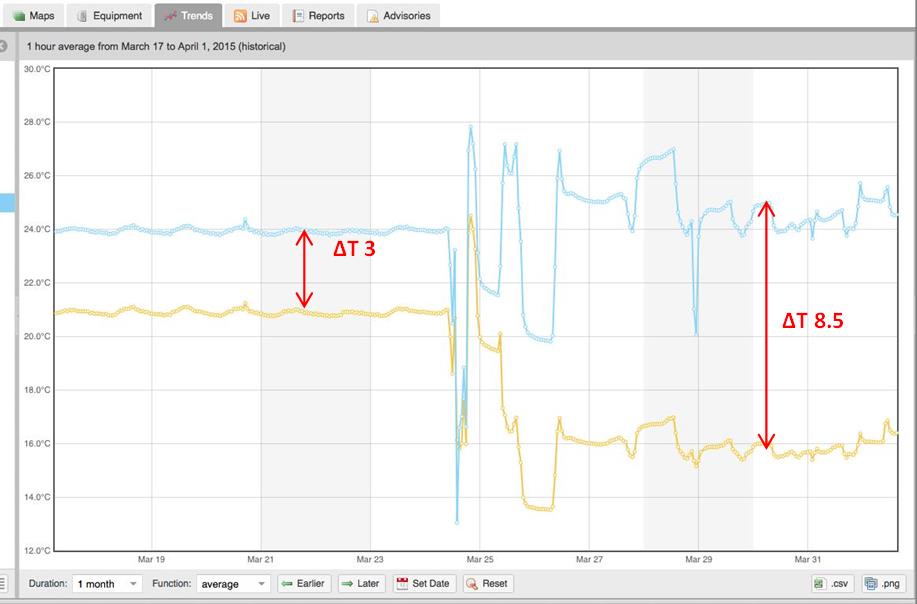
In a second facility, a mobile switching center for a major telco, the manager noticed a hot spot on the thermal map and sent a technician to investigate the location. The technician saw that some of the cooling coils had low delta T even though the valves were open, which implied a problem with the hydronics. Upon physical investigation of the area, he discovered that this was caused by trapped air in the coil, so he bled it off. The delta T quickly went from 3 to 8.5 – a capacity increase of more than 65 percent – as displayed on the following graph:


DeltaT

These examples are deceptively simple. But without analytics, the managers would not have been able to as easily identify the exact location of the problem, the cooling units involved, and have enough information to direct trouble-shooting action within the short time needed to resolve problems in a mission critical facility.

Analytics typically use the information already available in a properly monitored data center. They complement the experienced intuition of data center personnel with at-a-glance data that helps identify potential issues more quickly and bypasses much of the tedious, blood pressure-raising and time-consuming diagnostic activities of hotspot resolution.

Analytics are not the future. Analytics have arrived. Data centers that aren’t taking advantage of them are riskier and more expensive to operate, and place themselves at competitive disadvantage

Maintenance is Risky

No real surprise here. Mission critical facilities that pride themselves on and/or are contractually obligated to provide the “five 9’s” of reliability know that sooner or later they must turn critical cooling equipment off to perform maintenance. And they know that they face risk each time they do so.

This is true even for the newest facilities. The minute a facility is turned up, or IT load is added, things start to change. The minute a brand new cooling unit is deployed, it starts to degrade – however incrementally. And that degree of degradation is different from unit to unit, even when those units are nominally identical.

In a risk and financial performance panel presentation at a recent data center event sponsored by Digital Realty, ebay’s Vice President of Global Foundation Services Dean Nelson recently stated that “touching equipment for maintenance increases Probability of Failure (PoF).” Nelson actively manages and focuses on reducing ebay’s PoF metric throughout the facilities he manages.

Performing maintenance puts most facility managers between the proverbial rock and a hard place. If equipment isn’t maintained, by definition you have a “run to failure” maintenance policy. If you do maintain equipment, you incur risk each time you turn something off. The telecom industry calls this “hands in the network” which they manage as a significant risk factor.

What if maintenance risks could be mitigated? What if you could predict what would happen to the thermal conditions of a room and, even more specifically, what racks or servers could be affected if you took a particular HVAC unit offline?

This ability is available today. It doesn’t require computational fluid dynamics (CFD) or other complicated tools that rely on physical models. It can be accomplished through data and analytics. That is, analytics continually updated by real-time data from sensors instrumented throughout a data center floor. Gartner Research says that hindsight based on historical data, followed by insight based on current trends, drives foresight.

Using predictive analytics, facility managers can also determine exactly which units to maintain and when – in addition to understanding the potential thermal affect that each maintenance action will have on every location in the data center floor.

If this knowledge was easily available, what facility manager wouldn’t choose to take advantage of it before taking a maintenance action? My next blog post will provide a visual example of the analysis facility managers can perform to determine when and where to perform maintenance while simultaneously reducing risk to more critical assets and the floor as a whole.

Predictive Analytics & Data Centers: A Technology Whose Time Has Come

Back in 1993, ASHRAE organized a competition called the “Great Energy Predictor Shootout,” a competition designed to evaluate various analytical methods used to predict energy usage in buildings.  Five of the top six entries used artificial neural networks.  ASHRAE organized a second energy predictor shootout in 1994, and this time the winners included a balance of neural networks and non-linear regression approaches to prediction and machine learning.  And yet, as successful as the case studies were, there was little to no adoption of this compelling technology.

Fast forward to 2014 when Google announced its use of machine learning leveraging neural networks to “optimize data center operations and drive…energy use to new lows.”  Google uses neural networks to predict power usage effectiveness (PUE) as a function of exogenous variables such as outdoor temperature, and operating variables such as pump speed. Microsoft too has stepped up to endorse the significance of machine learning for more effective prediction analysis.  Joseph Sirosh, corporate vice president at Microsoft, says:  “traditional analysis lets you predict the future. Machine learning lets you change the future.”  And this recent article advocates the use of predictive analytics for the power industry.

The Vigilent system also embraces this thinking, and uses machine learning as an integral part of its control software.  Specifically, Vigilent uses continuous machine learning to ensure that predictions driving cooling control decisions remain accurate over time, even as conditions change (see my May 2013 blog for more details).  Vigilent predictive analysis continually informs the software of the likely result of any particular control decision, which in turn allows the software to extinguish hot spots – and most effectively optimize cooling operations with desired parameters to the extent that data center design, layout and physical configuration will allow.

This is where additional analysis tools, such as the Vigilent Influence Map™, become useful.  The Influence Map provides a current, real-time and highly visual display of which cooling units are cooling which parts of the data floor.

As an example, one of our customers saw that he had a hot spot in a particular area that hadn’t been automatically corrected by Vigilent.  He reviewed his Vigilent Influence Map and saw that the three cooling units closest to the hot spot had little or no influence on the hot spot.  The Influence Map showed that cooling units located much farther away were providing some cooling to the problem area.  Armed with this information, he investigated the cooling infrastructure near the hot spot and found that dampers in the supply ductwork from the three closest units were closed.  Opening them resolved the hot spot.  The influence map provided insight that helped an experienced data center professional more quickly identify and resolve his problem and ensure high reliability of the data center.

Operating a data center without predictive analytics is like driving a car facing backwards.  All you can see is where you’ve been and where you are right now.  Driving a car facing backwards is dangerous.   Why would anyone “drive” their data center in this way?

Predictive analytics are available, proven and endorsed by technology’s most respected organizations.  This is a technology whose time has not only come, but is critical to the reliability of increasingly complex data center operations.

IMG_7525_cliff250